
Purpose of Profit and Loss Forecast
The purpose of a profit and loss forecast is an estimation of future profitability or losses for a company.
It is the easiest way to understand how much money the business earns and will earn in the future. The net profit of a company shows how much money will come from the business. The net profit is the final line of the profit and loss forecast.
In addition, the profit and loss forecast is an important tool for business owners, CEOs, and managers in making decisions about the company development and updating the strategy.
I will show you why. As the profit and loss forecast shows the future profitability of the company, you can see the factors that influence it in advance and improve it.
Let’s discuss below how to improve the business profitability using the profit and loss forecast.
It can also be used by investors to make decisions about whether to invest in a company.
How to Improve a Business Profitability Using Profit and Loss Forecast
A profit forecast is not an exact prediction of future profitability, but rather an estimation based on the data for previous periods and other factors.
A certain list of variables can impact profitability, they will be considered below in detail.

The main variables that can impact profitability include:
- Sales volume;
- Selling prices;
- Costs of goods sold;
- Operating expenses;
- Interest expense;
- Taxes.
To improve profitability business owners or managers should think about what action can be taken:
- to increase sales volume and selling prices;
- to decrease expenses: costs of goods sold; operating expenses; Interest expenses; and taxes.
Having the profit and loss forecast, you can see, how can be changed the net profit of the company, when you change even 1 variable.
For example, your company sells T-shirts with prints for $12. The company sells on average 200 T-shirts per month and has monthly expenses in the amount of $400. You spend $5 to produce one T-shirt.
In this case, net profit per month = $12* 200 units – $5* 200 units – $400 = ($12-$5)*200 – $400 = $7*200 – $400 = $1000
If you increase the selling price or decrease the cost of goods sold to $1, the net profit per month will increase by $200 (by $2400 per year). So, you have 14% of the net profit growth in the case of increasing the selling price or decreasing the cost of goods sold to $1.
Explanation: new net profit per month = $13* 200 units – $5* 200 units – $400 = ($13-$5)*200 – $400 = $8*200 – $400 = $1200
Net profit growth = ($1200 – $1000)/$1000*100% = 20%
As you can see, one action led to an increase on the net profit by 20%.
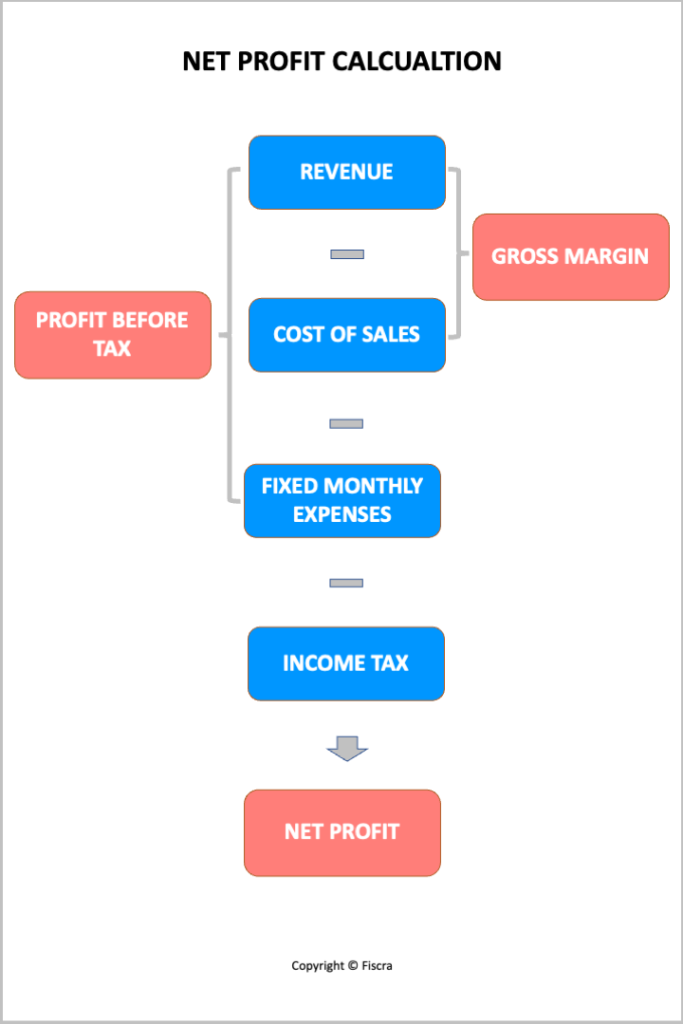
Steps of Profit and Loss Forecast
- Revenue forecasting:
- Sale volume forecast for each product/service;
- Prices estimation for each product/service;
- Revenue calculation multiplying sale volume on corresponding prices of the product/service;
- Total revenue calculation summarising revenue for each product/service.
- Cost of goods sold calculation:
- Estimation of variable expenses for each product/service;
- Cost of goods sold calculation multiplying sale volume on corresponding variable expenses of the product/service;
- The total cost of goods sold calculation summarizing the cost of goods sold for each product/service.
- Note: If you have no variable costs in your business point #2 can be missed.
- Gross margin calculation = Total amount from point #1 minus total amount of point # 2.
- Fixed monthly cost estimation.
It can be the monthly rent cost of premises, depreciation amount, salary of staff; taxes, etc. - Net profit calculation = Total amount from point #3 minus the total amount of point # 4.
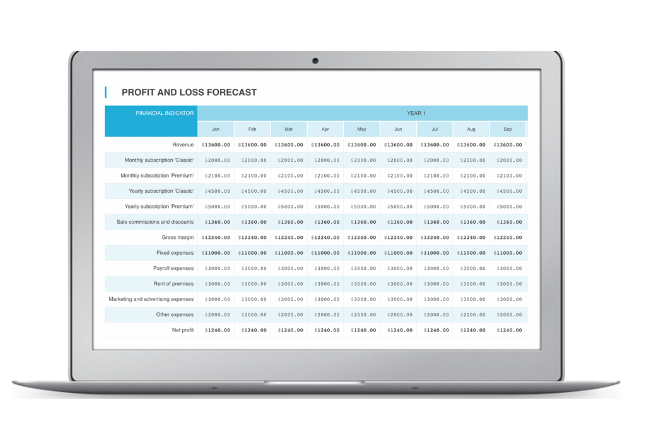
Profit and Loss Forecast Template
A profit forecast is usually done by using a profit and loss statement forecast. Please find below the detailed template of the profit and loss forecast.
Profit forecasts can be done on a monthly, quarterly, or annual basis.
| # | Financial indicator | Year 1 | Year 2 … | Comments |
|---|---|---|---|---|
| 1 | Revenue | = Sale volume of product 1 / service1 * Price for product /service 1 + Sale volume of product 2 / service 2 * Price for product /service 2 +… | ||
| 2 | Cost of sales | = Sale volume of product 1 / service1 * Cost of sales for product /service 1 + Sale volume of product 2 / service 2 * Cost of sales for product /service 2 +… | ||
| 3 | Gross Margin | = Total amount from point #1 minus total amount of point # 2 | ||
| 4 | Fixed costs | = Monthly expenses including Payroll costs, rent, marketing expenses, etc. | ||
| 5 | Profit before tax | = Total amount from point #3 minus total amount of point # 4 | ||
| 6 | Income tax | = Total amount from point #4 * income tax rate | ||
| 7 | Net Profit | = Total amount from point #5 minus total amount of point # 6 |
Profit and Loss Forecast Example of Calculations
1. Initial data for profit forecast:
Let’s consider the example of a profit forecast.
The legal firm ‘Oneida’ wants to estimate profit for next year.
It has the following initial data:
1.1 List of services with prices, the volume of sales, time spent, and staff rates:
| Name of services | Price | Volume of sales | Working hours spent by staff | Hourly rate of staff |
|---|---|---|---|---|
| Monthly support of clients | 500$ per month | clients in the current year + 1 new contract will be signing off with a new client at the beginning of the year | 8 hours/month per client | 20$/hour |
| One-time consultation | 50$ per hour | 10 consultations on average per month | 1 hour per consultancy | 20$/hour |
| One-time consultation + writing report | 100 $ per hour | 5 consultations on average per month | 1,5 hours per consultancy | 20$/hour |
1.2 Monthly expenses include:
- Rent of office 500$;
- Salary of administrative staff 2000$;
- Depreciation of office equipment 200$;
- Internet & telephony 100$;
- Office expenses 50$.
1.3. No loan and interest expenses;
1.4. Income tax rate 15%;
Let’s estimate profit based on the initial data above.
2. Profit and loss forecast:
| # | Financial indicator | Year 1 | Calculation |
|---|---|---|---|
| 1 | Revenue | 60000$ | =500$*8 clients +50*$10 consultations+ 100$ *5 written consultations= 5000$ per month. Revenue per year = 4000$*12 months=60000$ |
| 2 | Cost of sales | 19560$ | =8 hours* 8 clients *20$ per hour +1 hour*10 consultations *20$ per hour+ 1,5hours*5 written consultations *20$ per hour= 4000$ per month. Cost of sales per year = 1630 $*12 months=19560$ |
| 3 | Gross Margin | 40440$ | =60000$-19560$=40440$ |
| 4 | Fixed expense | 34200$ | =500$ for office rent + 2000$ for salary of administrative staff + 200$ for depreciation of office equipment + 100$ for Internet & telephony + 50$ for Office expenses =2850$ per month. Fixed expenses per year = 2850$ *12 months= 34200$ |
| 5 | Profit before tax | 6240$ | =40460-34200=6240$ |
| 6 | Income tax | 936$ | =6240$*15%=936$ |
| 7 | Net Profit | 5304$ | =6240$-936$=5304$ |
Creating a Profit and Loss Forecast with Our Calculator in a few minutes

Let’s go through a simple guide on how to make a profit and loss forecast using our easy online financial projection calculator. It’s pretty quick; you just need to put in your starting details (like your costs and what you think you’ll sell) and press the calculate button. This way, you can get your profit and loss forecast in just a few minutes. You don’t need to know a lot about finance to use it, which is great for people running businesses who haven’t had to do this kind of thing before. The calculator page is available on your mobile phone, tablets, and laptops or computers.
Step 1: Input Prices for Your Profit and Loss Forecast
First, you need to choose 6 of the most popular products or services of your business and input the selling prices of each of them.
=> If you have a lot of products/ services, you can group them into 6 types and input average selling prices for each type. If it is a retail clothing shop it can be T-shirts, suits, dresses, sweaters, trousers, and coats.
=> Steps 1 to 6 will be described in detail on how to input initial data ( assumptions). Then you need to click the button “Calculate” to receive the profit and loss forecast for 3 years.
=> This financial projection calculator enables the creation of a 3-year profit and loss forecast. Select “Use the same values for 2-nd and 3-rd year” for easier data entry if consistent data is expected.

Step 2: Calculate Your Direct Costs for Profit and Loss Forecast
Dissect the direct costs associated with your offerings, unraveling the expenditures tied to production and service provision.
It can be:
- the cost of raw materials for your product;
- or the amount paid for hours of service delivery;
- or purchase price for your retail shop.
Understanding these figures is crucial for gauging your profitability.

Step 3: Estimate How Much You’ll Sell
Utilize historical sales data, market analysis, and industry trends to forecast the volume of sales. This step merges intuition with data, allowing for a predictive glance at future customer transactions and financial inflows.

Step 4: Consider Discounts and Commissions
Factor in the financial impact of marketing strategies such as discounts and the potential outflow of sales commissions. These elements play a significant role in shaping the net profit figure and are pivotal in price strategy planning.
=> Sale commissions and discounts are calculated here and a percent of selling prices.
=> If you have no commissions and discounts connected to your business, change numbers to zero.

Step 5: Add Up Your Running Costs
Aggregate the day-to-day expenses that keep your business engine running. It can be rent cost, salary, utility bills, and advertising, this step ensures a holistic view of your operational expenditure.

Step 6: Work Out Starting Costs
Assess the capital needed to either kickstart your venture or push it into its next growth phase.
Investments usually include:
- Legal and Administrative Costs: Expenses for business registration, licenses, permits, and legal counsel to ensure compliance with local, state, and federal regulations.
- Market Research and Business Planning: Costs associated with conducting thorough market research and business plan development to validate the business concept and strategies.
- Branding and Marketing: Investments in brand development, marketing materials, website creation, and initial advertising campaigns to establish brand presence and attract customers.
- Product Development: Costs related to product design, prototype creation, and testing for businesses offering physical goods.
- Technology and Software: Investments in computer hardware, software subscriptions, and other technology infrastructure necessary for modern business operations.
- Office or Retail Space: Costs for purchasing physical space, and renovations to suit business needs, furniture for your office, or other business needs.
- Equipment and Machinery: Purchase or lease of essential equipment, machinery, or vehicles required for product manufacturing, service delivery, or business operations.
- Personnel and Training: Salaries, benefits, and training for the first group of employees to ensure a capable and efficient workforce from the start.
- Working Capital: Funds allocated to cover operating expenses during the early stages of the business before it generates a steady income.
=> Calculate all initial investments necessary to start your business and input the total amount into the field below.
=> Click “Calculate” to receive a profit and loss forecast.

Step 7: Get Your Profit and Loss Statement
The culmination of your data input is a detailed profit and loss statement, crafted by the calculator. This document is a cornerstone of financial reporting, depicting whether your business stands to gain profit or bear losses in the foreseeable future.
7.1 For the first year you receive the detailed profit and loss forecast:

7.2 At the end of the profit and loss forecast you can see the total financial data ( revenue, expenses, and profit) for each of the 3 forecasted years:

Step 8: Financial Analysis of the Financial Data
The automatic calculation of the main financial ratios is available on the calculator page: ROI, profitability calculation, net profit, and revenue growth. These financial KPIs will help you to assess the financial prospects for your business.

Step 9: Look at the Graphs and Diagrams
The tool’s visual outputs, including graphs and charts, translate your financial data into an easily digestible visual format. This step turns numbers into narratives, offering visual storytelling of your financial journey, and spotlighting trends and pivot points.
9.1 Analyze the profitability growth, revenue, expenses, and net profit forecast for 3 years:

9.2 The structure of revenue will show you the main sources of income, the structure of expenses will help you to understand how to optimize the company expenses.

Step 10: Review Your Numbers
Engage in a thorough review of the generated forecast, scrutinizing the data for accuracy and plausibility. This reflective step is your opportunity to refine and adjust, ensuring your financial blueprint is both realistic and aligned with strategic business goals.
=> Click the ‘back‘ arrow to update your initial financial data:

After walking through the straightforward steps of using our online financial projection calculator, you’ll find that creating a profit and loss forecast is not only effortless but also incredibly efficient. With just a few clicks and your initial data entered, the calculator will provide a detailed forecast, enabling you to make sound financial decisions for your business’s future. This tool demystifies financial projections, making it an essential asset for entrepreneurs and business owners, regardless of their financial background.
Online financial projection calculator can be used for any type of business for profit and loss forecast creation. It is universal.
However, if you need something more specific, open the page with the list of all calculators and choose the calculator for your specific type of business.
It can be a hotel, hospital, clothing store, subscription or service business, and many others.
Let’s summarize all the information described above.
Conclusions in Profit and Loss Forecast
- You need to have the initial data for profit forecasting (ex: list of products/services, their prices, and volume; sales, amounts of expenses), thus you need to understand your business. The whole list of the initial data for profit forecasting is in the example above and in the described step-by-step guide for using the calculator to create a profit and loss forecast;
- The main elements of any profit and loss forecast are revenue (income of the business), expenses, and net profit.
- You need to analyze the profit forecast after it is calculated (Ex: Is it a response to your expectations; how it can be improved; if it is possible to increase the profit; what actions are necessary for increasing the profit);
- As you can see in the provided short example, the profit can be increased by:
- Increasing prices;
- The increasing volume of sales;
- Decreasing expenses.
So, you need to check if it is possible for your business.
You can see in the example that the profit is enough low and should be improved;
- You can create from scratch a profit and loss forecast using Excel or Google Sheets. In this case, you need to understand the basics of finance. Although, depending on your business the calculation can be more difficult. At the same time creating a profit and loss forecast with our calculators doesn’t need any additional knowledge, so you can use it to start.
Frequently Asked Questions on Profit and Loss Forecast
What is a Profit and Loss Forecast? A Profit and Loss Forecast is a financial tool that predicts a business’s revenue, expenses, and net profit over a specific future period. It helps businesses plan their financial strategy by estimating future financial performance.
Why is creating a Profit and Loss Forecast important for a business? Creating a Profit and Loss Forecast is crucial because it allows business owners and managers to anticipate financial results, make informed decisions, allocate resources efficiently, and prepare for future financial challenges and opportunities.
Who needs to prepare a Profit and Loss Forecast? Any business owner, entrepreneur, or manager looking to understand their business’s future financial performance should prepare a Profit and Loss Forecast. It’s especially vital for startups and growing businesses to guide their financial planning.
Can I create a Profit and Loss Forecast without accounting knowledge? Yes, you can create a basic Profit and Loss Forecast without in-depth accounting knowledge. Various templates and software tools like our free calculators are designed to simplify the process, making it accessible for non-financial individuals.
How often should I update my Profit and Loss Forecast? It’s recommended to update your Profit and Loss Forecast at least quarterly or whenever there are significant changes to your business operations, market conditions, or financial strategy to ensure it reflects the most current information.
What information do I need to prepare a Profit and Loss Forecast? You’ll need detailed information about your expected revenue, including sales forecasts, cost of goods sold (COGS), and all operating expenses, such as rent, salaries, marketing costs, and other overheads.
How far into the future should my Profit and Loss Forecast extend? Typically, a Profit and Loss Forecast should extend for at least one year into the future. However, many businesses also create forecasts for up to three to five years to support long-term planning and decision-making.
What’s the difference between a Profit and Loss Forecast and a Profit and Loss Statement? A Profit and Loss Forecast is a projection of future financial performance, while a Profit and Loss Statement is a record of actual financial performance over a past period. The forecast is used for planning, and the statement is used for reporting.
Can a Profit and Loss Forecast help in securing funding? Yes, a well-prepared Profit and Loss Forecast can be a critical component of a business plan or funding application, demonstrating to potential investors or lenders the projected profitability and financial viability of your business.
What common mistakes should I avoid when preparing a Profit and Loss Forecast? Common mistakes include overly optimistic revenue projections, underestimating expenses, and not updating the forecast regularly to reflect changes in the business or market.
About the author